Augmenting StarCraft Player Performance with Dashboard Analytics
Augmenting StarCraft Player Performance with Dashboard Analytics
StarCraft II is a Real Time Strategy Game released by Blizzard. It is one of the first e-sports that consolidated this industry and has a large community. From 2021 to 2019, more than 15 championships with a total reward of more than 1M dollars took place across the world. High ranked players have had cumulative earnings of 500K, and every year it unites thousands of players across several championships around the world.
StarCraft Game itself gives some insightful analytics about each game once the game is over, to give hints about the overall performance of the game over time in graphs of Army Value, Active workers, and upgrades over time. Besides, in terms of overall performance, they offer metrics such as non-consumed resources, number of units and workers created and APM (Actions per minute)

Fig1. Some data that StarCraft 2 games gives you after play
Today we will dig into an analysis taking into account the dataset elaborated by Thompson JJ et al SkillCraft1 Master Table Dataset supported by the paper Video Game Telemetry as Critical Tool in the Study of Complex Skill Learning.The main aim of this study is to study telemetry data in order to understand complex skill development. The study identify cognitive-motor, attentional and perceptual processing data.
Taking into account the dataset of SkillCraft [1] we can enhance or propose a new analytics dashboard that could help the player to know more about its game performance, comparing it with previous or higher league in order to help the player to know where he/she stands with respect to others. This dashboard might be offered to the player at the beginning and the end of the league, offering a tool for measuring efficiency of the player across the season.
Attention and dexterity: APM, PACs and Action Latency
Actions per minute (APM) is a measurement of a player’s load-handling capacity and is one of the metrics for judging player skill [2]. Ideally, APM includes only ‘productive’ actions. However, APM may be artificially inflated by superfluous repetitive actions. As an isolated metric, APM offers partial value , as it might be worth study if it is a metric that is correlated with some hot keys use (such as number of unique hot keys, assignation and selection).
The Perception Action Cycle is a metric to measure attention inside StarCraft II. According to the authors of the paper Video Game Telemetry as a Critical Tool in the Study of Complex Skill Learning, each variable pertains to a period of time where players are fixating and acting at a particular location. Inside the game, a predominant set of actions occur inside this perception action cycle. One of the main game moments that might be inside this definition include looking at the map in certain location and executing certain kind of actions, shifting then to another location. In general, a higher PaCs number give an example of multitasking or good skill, and ultimately set a difference in between different leagues.
In order to demonstrate the importance of these variable across the progress of the player, we have produce several experiments. The correlation matrix between League Index and different variables show interesting insights: higher APMs and Number of PACs are associated with higher ranking in the StarCraft League, and lower Gap between PACs and Action Latency are associated with higher leagues, making us stablish the hypothesis that the higher number of actions per second and number of attention cycles the better the player might be, and the lower time in executing actions are also an indicator of a higher league.
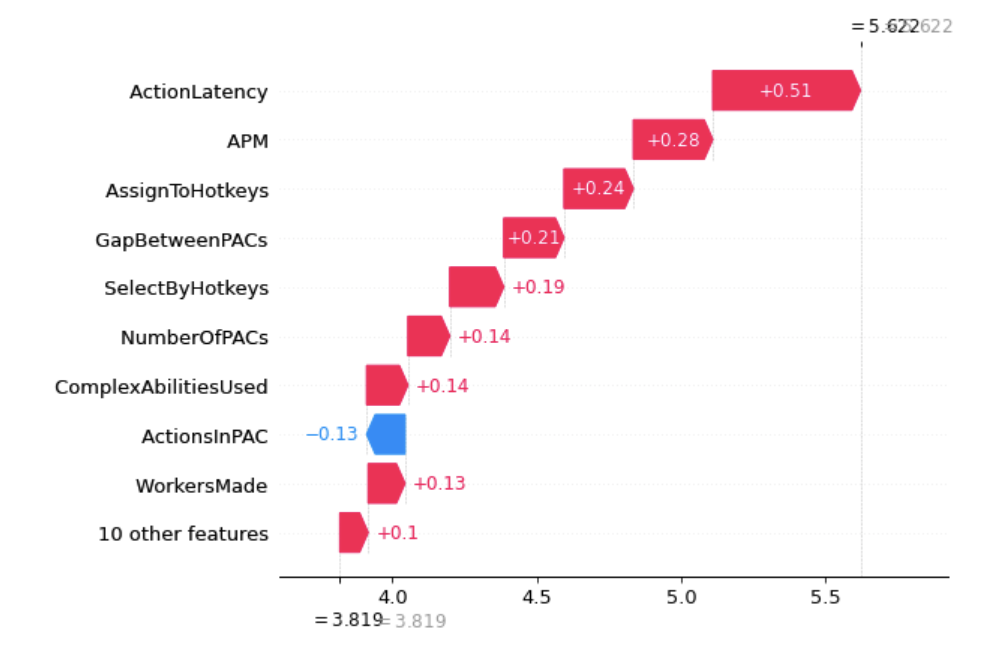
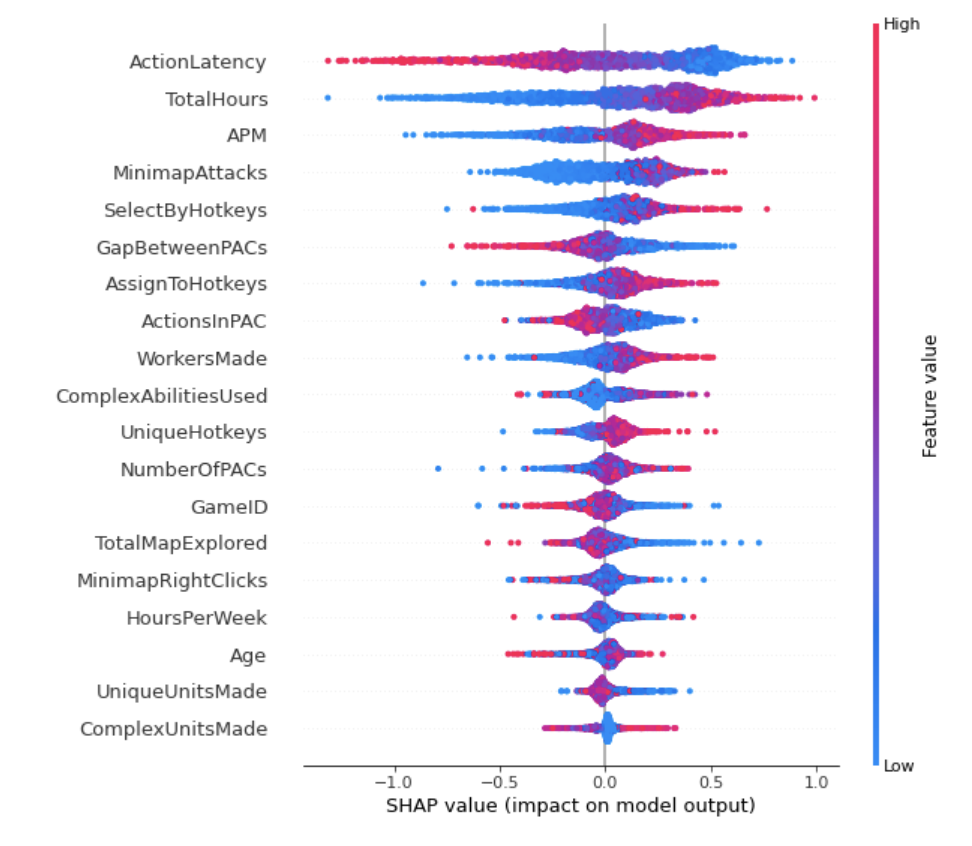
Taking another approach from the machine learning perspective, we´ve build a Index League XGBoost classifier for measuring the feature importance of different features regarding classification in the league using SHAP [3] explainability framework.


Fig 4. SHAP. Shown in Red features that contribute to push the model output from the base value. In this case, the XGBoost classifier shows that Action Latency , APM, Hotkey key behaviours and Gaps between PACs highly influence the model

Comparison of APM and PaCs in all leagues. As the skill of the player increases, so does the the APM and the Number of PACs, and the Gap between Caps decreases.
Dashboard analytics: Measuring performance and attention
Having into account previous game analysis , we can propose the following dashboard that might be given to the player at the beginning and end of the season, having into consideration that this might offer the player an opportunity to compare its performance to previous and higher league in order to improve the gameplay. Besides that, we can add recommendations to improve gameplay focusing on analytics coming from the next league, such as number of hot keys assignments. For that, we take the median and mode values of the next league and compare values from the current league in order to compare them.
With these conclusions coming from the analysis of the dataset, we can came with an analytics dashboard divided into three main categories : attention, dexterity and Recommendations. These three categories include the analysis coming from the previous and the next league in a set of equally distributed set of games across the different leagues.
[1] SkillCraft Dataset
[2] Judging player skill
[3] SHAP explainabilty dataset
Do you want a data-driven solution?


