Table of Contents
To predict herd immunity in a given country given the data, we studied different parameters coming from country vaccinations dataset. We selected total_vaccinations and people_fully_vaccinated_per_hundred having into account this last ratio as one of the significant ones for measuring immunity progress. If you want to know more about previous exploratory analysis with insightful insights such as the correlation in between the country GPD Growth and immunity progress coming from COVID data, you can have a look here. And in this post we will look at forecasting immunity vaccination progress with Prophet
Forecasting Immunity Vaccination
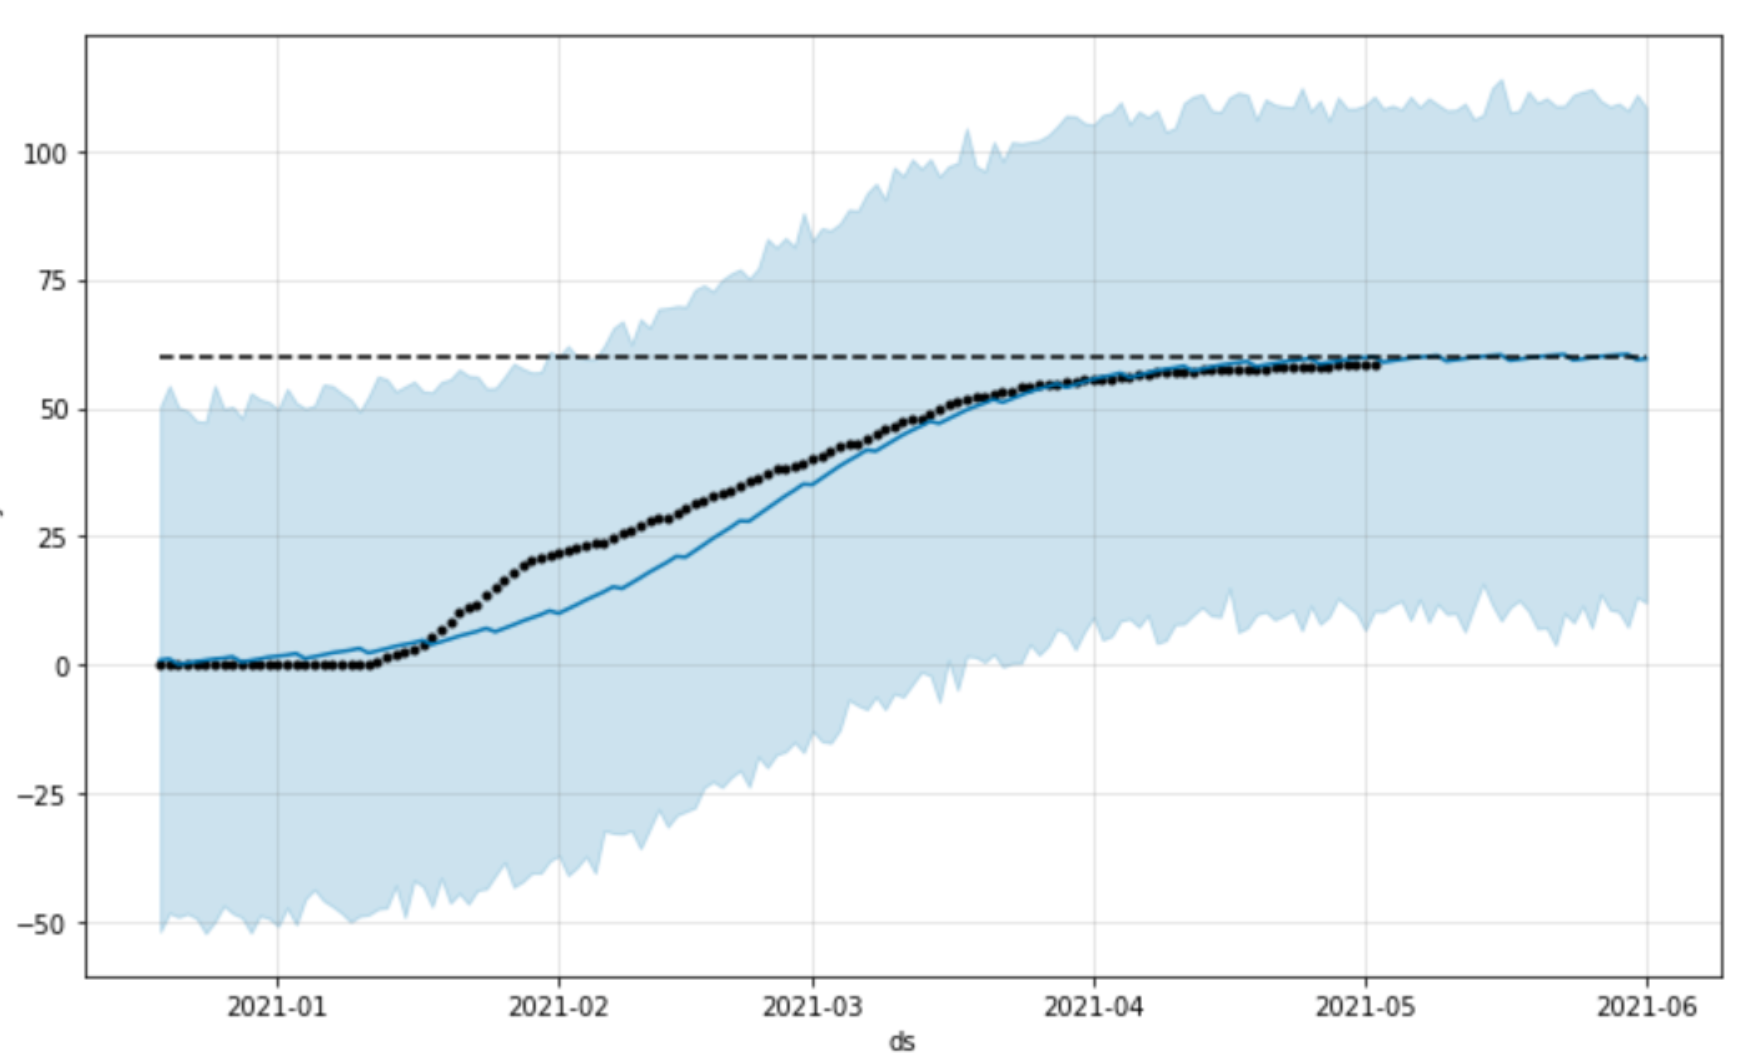
As for finding the most significant Forecasting tool, we Line Plotted the cumulative sum of people_fully_vaccinated progress over time for visualizing the type of growth. As a conclusion, we find out that the pattern follows a type of logistic growth curve , aiming for a behaviour in which herd immunity starts small but increases exponentially, but then starts to decrease towards and asymptote. When thinking about this type of logistic growth curve, there is usually some maximum achievable point: total market size, total population size, etc. This is called the carrying capacity parameter, and the forecast should saturate at this point.For our prediction model, the key concept is to assume a cap parameter that might be aligned with the vaccination rhythm or behaviour.

According to data sources, Israel have standed as a vaccination leader. Having different age range groups, a heavily marketed vaccination campaign and an restlessness vaccination rhythm have been key successful factors for achieving these results.
Why use Prophet ?
Prophet is a forecasting procedure implemented in R and Python. It is fast and provides completely automated forecasts that can be tuned by hand by data scientists and analysts. It heavily takes into account seasonality and has been used for predicting the impact of facebook campaigns . It indeed offers flexibility and auto tuning of several parameters.
We selected this tool because it allows us to establish a logistic growth forecast model with a cap parameter as a growing sequence, following the pattern that herd immunity follows.Besides, it allows to select the prediction days we want .
When implementing carrying capacity, we design a python function with numpy that will follow the growth rhythm that has been observed in the cumulative sum of people_fully_vaccinated ratio.
def create_cap_sequence(dataset, n_days, growth_pattern):

    '''Creates a cap sequence list for forecasting growth and
    implements it as a column in a dataframe

        Args :
            dataset for prediction
            number of days
            growth_pattern : increase of people_fully_vaccinated per day
    '''


    interval = 1
    list_cap = np.arange(0, interval* n_days, growth_pattern)
    dataset['cap'] = list_cap

    return dataset
In order to scale this model for all countries, we shall instantiate its own logistic growth model taking into account the carrying capacity. For that , we shall understand that each country has its own growth cap sequence and consistently implement it using the function described in Fig3.
When creating the machine learning Prophet model, we shall take into account to select the parameter logistic when we instantiate it, periods as the number of days that we want to predict.
def prophet_model(dataset, number_of_days, cap_parameter):

    '''Creates the machine learning model for forecasting herd inmunity,
    a forecast dataset and returns the plot

        Args :
            dataset : country dataset that includes renamed columns for
            Prophet, and the carrying capacity column

            number_of_days : number of days to predict
            cap_parameter : total carrying capacity of herd imnutiy per country

        '''

    model = Prophet.Prophet(growth='logistic')
    model.fit(dataset)
    future_dataset = m.make_future_dataframe(periods = number_of_days)
    future_dataset['cap'] = cap_parameter
    forecast = model.predict(future_dataset)

    return model.plot(forecast)
Conclusions
Population has been educated to take safety precautions and measurements for ‘lowering ‘ a normal distribution inflection curve . Immunity progress follow a logistic pattern, now it might be the time to aim and support all initiatives that follow a logistic curve and might increase the carrying capacity.


